Quantitation: Report format
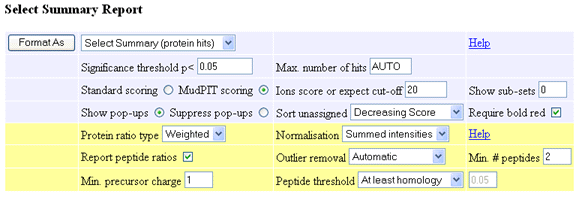
When the quantitation method is either Reporter or Multiplex, additional formatting controls are displayed near the top of the Mascot
result report. After making changes to any of these controls, choose the Format As button to reload the report using the new settings.

Protein ratio type: A drop down list with the choices Average, Median, and Weighted.
- Average: The protein ratio is the geometric mean of the peptide ratios
- Median: The median peptide ratio is selected to represent the protein ratio. If
there are an even number of peptide ratios, the geometric mean of the median pair is used
- Weighted: For each component, the intensity values of the assigned peptides are summed
and the protein ratio(s) calculated from the summed values. This gives a weighted average,
which will be the best measure if the accuracy is limited by counting statistics. When a
weighted average is reported, the standard deviation is the weighted standard deviation.
Normalisation: A drop down list with the choices None, Average ratio, Median ratio, and Summed intensities.
- None: No normalisation is performed
- Average ratio: For each reported ratio, a correction factor is applied such that the geometric mean for that ratio
for all peptide matches in the data set would be unity
- Median ratio: For each reported ratio, a correction factor is applied such that the median for that ratio
for all peptide matches in the data set would be unity
- Summed intensities: Total intensities for each component across the entire data set are made equal
Report peptide ratios: When checked, ratios for individual peptides are included in the peptide match tables.
Outlier removal: The available methods for testing and removing outliers are None, Automatic, Dixon's method,
Grubbs' method, and Rosner's method. Choosing auto means that Dixon's method will be used if the number of values is between 4 and 25,
while Rosner's method will be used if the number of values is greater than 25. For a detailed description of each method,
refer to the Statistical procedures page.
Min. # peptides: The minimum number of valid peptide match ratios that are required in order to report a protein
hit ratio.
Min. precursor charge: A peptide ratio will not be reported if the precursor charge is less than this value. Note
that this number is compared with the absolute precursor charge. If you are analysing negative ion data, and the setting is 2, a peptide match
with a charge of [M-3H]3- will be used for quantitation, while a match with a charge of [M-H]- will not.
Peptide threshold: A peptide match will only be used for quantitation if it meets this criterion. The choice is
Minimum Score, Maximum expect, At least identity (threshold), and At least homology (threshold). For the first two choices,
an appropriate value must be entered in the adjacent edit box.
When the quantitation method is either Reporter or Multiplex, there are several additions to the main Mascot result report.
Quantitation related information is presented on a yellow background, in four main areas: the header, the format controls,
(described above), a quantitation summary for each protein hit, and ratios for individual peptides, (optional).

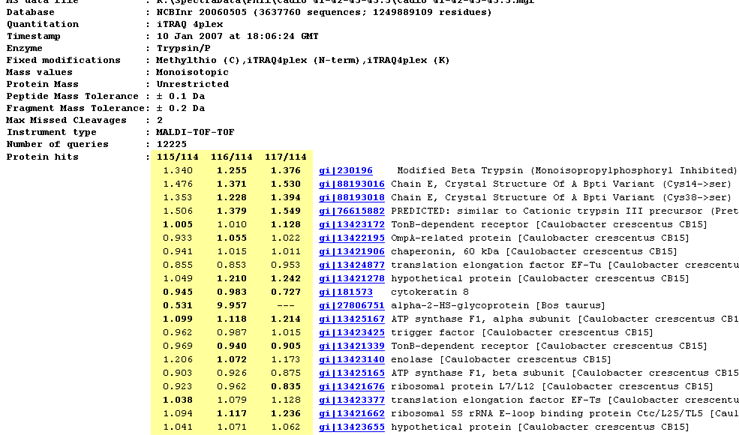
The report header includes a list of the protein hits tabulated in the body of the report. Where quantitation information
is available, it is listed alongside each protein. The ratios to be reported and the column headings are specified as
part of the quantitation method.
- If a ratio is shown in bold face, it is significantly different from 1 at a 95% confidence level.
More details can be found on the Statistical procedures page.
This may or may not be meaningful.
In this screen shot, for example, the top hits are trypsin variants, so the quantitation information is simply
irrelevant.
- If a ratio is missing, this will usually be because the number of valid peptide match ratios was less than the
stipulated minimum.

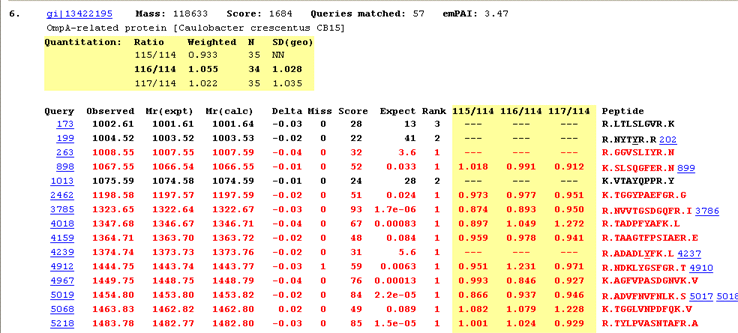
For each protein hit, a table shows the average ratio(s) for the protein, together with the number of peptide
ratios that contributed, N, and the geometric standard deviation, SD(geo). If the number of valid peptide
match ratios was less than the stipulated minimum, dashes will be displayed. If the peptide match ratios do not
appear to be a sample from a normal distribution, NN
(not normal) will be displayed. As mentioned previously,
bold face indicates a ratio that is significantly different from 1 at a 95% confidence level.
Since we are dealing with ratios, the average is the geometric mean
and the standard deviation is the geometric standard deviation, which is a factor.
In other words, the confidence interval is obtained by dividing and multiplying the average by the standard
deviation, which is never less than 1.0. For example, if the average is 1.055 and SD(geo) is
1.028 then the 95% confidence interval is 1.026 to 1.084.
Warning: The standard deviation reported here measures the variance
within the data submitted for a single Mascot search. This will often be tiny compared with the variance between technical
replicates, (i.e. repeated analyses of this same sample). This, in turn, will invariably be tiny compared with
the variance between biological replicates, (analyses of samples from different subjects or different treatment
groups). It can be dangerous to read too much into small changes within a single search when the biological variance is huge.
For a more detailed discussion, see
Karp, N. A., et al., Impact of replicate types
on proteomic expression analysis, Journal of Proteome Research 4 1867-1871 (2005).
Individual peptide match ratios will be displayed if the Report peptide ratios checkbox is checked. Dashes
are displayed when a ratio cannot be determined. This may be because one or more of the relevant peaks were missing,
giving a ratio which was zero, infinity, or indeterminate. Alternatively, the peptide match may have been rejected
on quality grounds. For example, a disallowed charge state or modification. If a ratio is negative, which indicates
some instrument or peak detection problem, (or an inappropriate correction),
this is reported. However, a negative ratio is discarded when calculating the protein ratio.
The screen shot illustrates a Select Summary report, where detailed information is only displayed for the strongest
match to each unique peptide sequence. The quantitation information also pertains to just the strongest match. It is
not an average of all the matches in the row.
|